This article started as a response to a reader who asked how accurate an InBody scan is. Her scan a month earlier had shown fat loss. Now the same machine was telling her she’d gained fat and lost muscle. Could her body composition really have flipped this much despite no change in her diet or training?
As I started writing, I realised a short answer wouldn’t do the question justice. So what follows is a deep dive into InBody and body composition testing: how it actually works, how accurate it really is, whether it can reliably track changes over time, and whether the number on the printout even matters in the first place.
But before we get to the InBody, let’s take a brief detour to understand how body composition is measured in the first place.
How is body composition tested?
The most direct way to measure body composition would be to chemically analyse the body itself, and it’s the gold standard for body composition analysis. But there’s a small problem with this method: you need to be dead. So, assuming that isn’t in your plans for the near future, you’ll be relying on an indirect method instead.
The best practical method is the four-compartment (4C) model, which separates the body into four major components: fat, water, minerals, and protein/residual mass. Unfortunately, you won’t find the 4C model at your local gym because it requires multiple pieces of equipment, trained technicians, time, and lots of money. 1
This is where DEXA comes in. DXA is a three-compartment model that separates fat, soft lean tissue, and bone mineral content. It’s faster, easier, and more accessible than the 4C model, which is why it’s commonly used in body-composition research. But it still has to assume things about what’s inside that lean mass — like how much of it is water — and those assumptions can introduce error.
Finally, we have two-compartment models that split body composition into fat and fat-free mass. Several methods can operate within this framework, including BIA, underwater weighing, and air displacement plethysmography (BodPod).
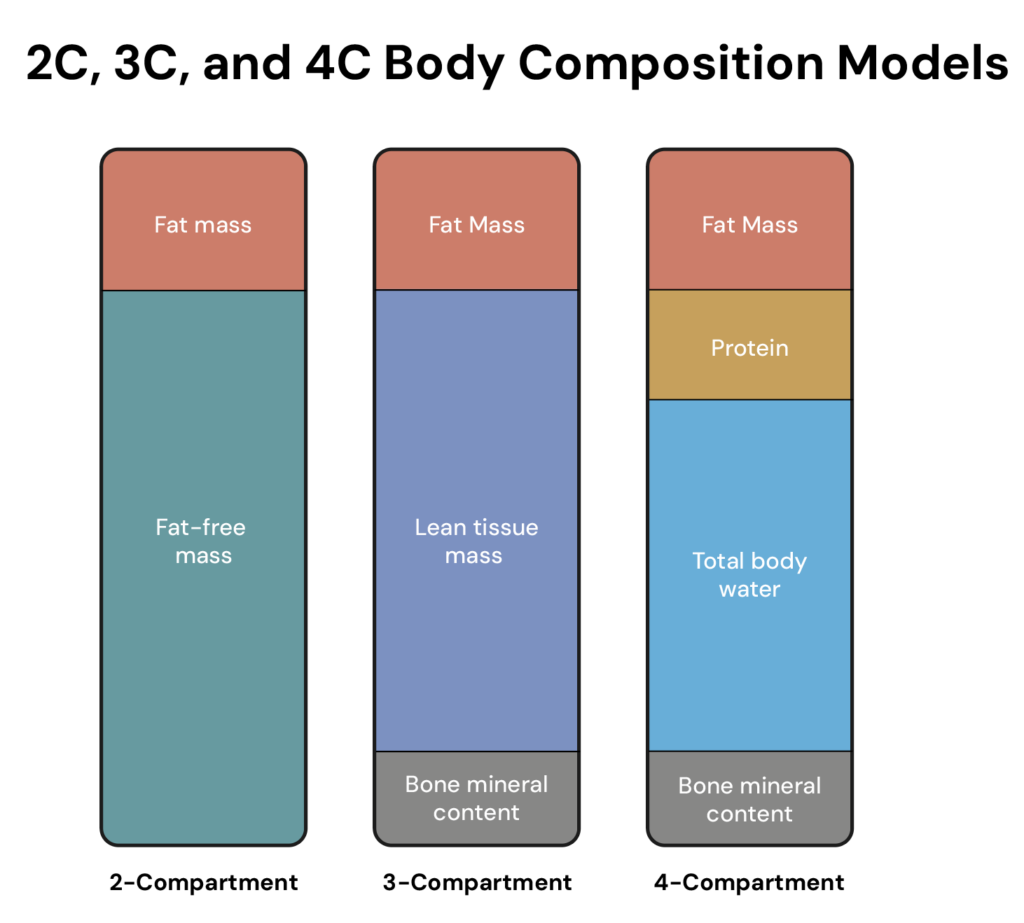
So, when we take all that into account, the important bit is this: Body composition tests don’t directly measure your body fat or muscle mass – they estimate them using assumptions. The 4C model makes fewer assumptions because it separates the body into more components. DXA makes more assumptions. And BIA devices, like the InBody, are – well, let’s get to that next.
What is BIA actually measuring?
When you step on a bioelectrical impedance analysis (BIA) machine, it gives you numbers for body fat and lean mass, so you’d be forgiven for thinking that’s what it’s directly measuring.
But it isn’t.
What it’s actually measuring is impedance – how much your body resists a small electrical current. From there, it works through a chain of assumptions to arrive at an estimated body fat percentage.
Here’s a brief overview:
- Step 1: A weak electrical current is sent through the body, and the device measures the resistance it encounters. Fat-free mass, like muscle, organs, and connective tissue, is roughly 73% water, and water conducts electricity easily, so the current passes through with little resistance. Fat tissue contains less water (around 10%), so it resists the current more.
- Step 2: From that resistance (or impedance) reading, it estimates your total body water using regression equations.
- Step 3: From your total body water, the machine estimates your fat-free mass. It does this using a fixed assumption that fat-free mass is always 73% water. So if it knows how much water you have, it can work backwards to calculate how much lean tissue you have.
- Step 4: It subtracts your estimated lean mass from your total body weight to get your fat mass, and then divides by your total body weight to get your body fat percentage.
At its simplest, BIA takes one electrical reading and infers everything else from it. I’m sure you can already see the problem: If there’s an error anywhere in that chain, everything else falls apart. If your total body water is estimated slightly wrong in step one, your fat-free mass is wrong in step two, which makes your fat mass wrong in step three, which makes the final body fat percentage estimate wrong.
As it turns out, the assumption that fat-free mass is always around 73% water doesn’t necessarily hold at the individual level. When researchers measured FFM hydration in 128 young adults, the average was about 72%. But individuals ranged from 69% to 75%. In a more detailed analysis of 58 athletes, the researchers compared body fat estimates from the simpler 2-compartment model with the 4-compartment model. They found that variation in FFM hydration was almost perfectly correlated with body fat estimation error. 2
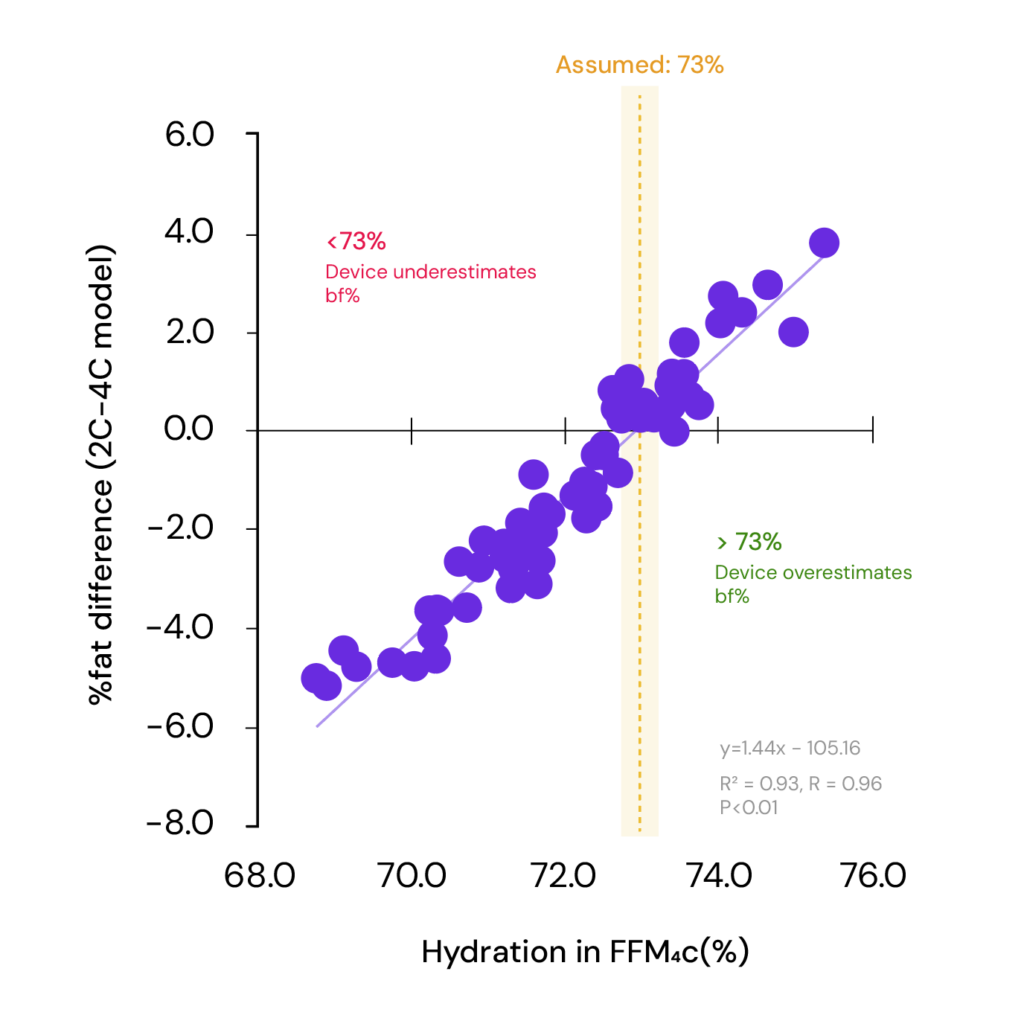
Adapted from Sagayama H et al. 2020
But there’s another issue: Standard BIA devices treat your body like one big cylinder, which is obviously not an accurate representation of the human body, where the arms and legs are long, and the torso is short and wide. So, although your torso makes up a huge chunk of your body mass, it contributes relatively little to the total resistance the device measures.
In a paper by Foster and Lukaski, the authors noted that the largest contributors to whole-body resistance are the forearm (28%) and the lower leg (33%), which together account for 61% of the total resistance, despite each making up only about 1.5–3% of your body weight. Meanwhile, your torso, which holds over 50% of your body weight and fat-free mass, contributes just 9% of the total resistance the device measures.
These are the issues that InBody tries to solve.
Unlike a standard BIA device, the InBody uses an eight-electrode system that measures at six different frequencies across five body segments: right arm, left arm, right leg, left leg, and trunk, for a total of 15-30 impedance measurements, depending on the model.
Ooh, so fancy. Surely with such a sophisticated approach, InBody has to be accurate at estimating your body composition, right?
Before answering that, we need to ask: accurate compared with what? Since the 4-compartment model is generally considered the criterion method for estimating body composition in living humans, that’s the comparator we’ll use.
How accurate is InBody?
Brewer and colleagues tested the InBody 770 against the 4C model in 82 healthy normal-weight adults (26 men; 56 women). At the group level, the InBody 770 looked pretty good. It overestimated body fat percentage by only 1.4 percentage points in men and 1.7 percentage points in women.
But group averages don’t mean much to you as an individual who wants to know how accurate the InBody is for estimating your body fat %. To understand that, we have to look at the individual error.
The image below is a Bland-Altman plot, the standard way researchers show how well two measurement methods agree. In this case, how well does InBody estimate total body fat percentage compared with the 4C model?
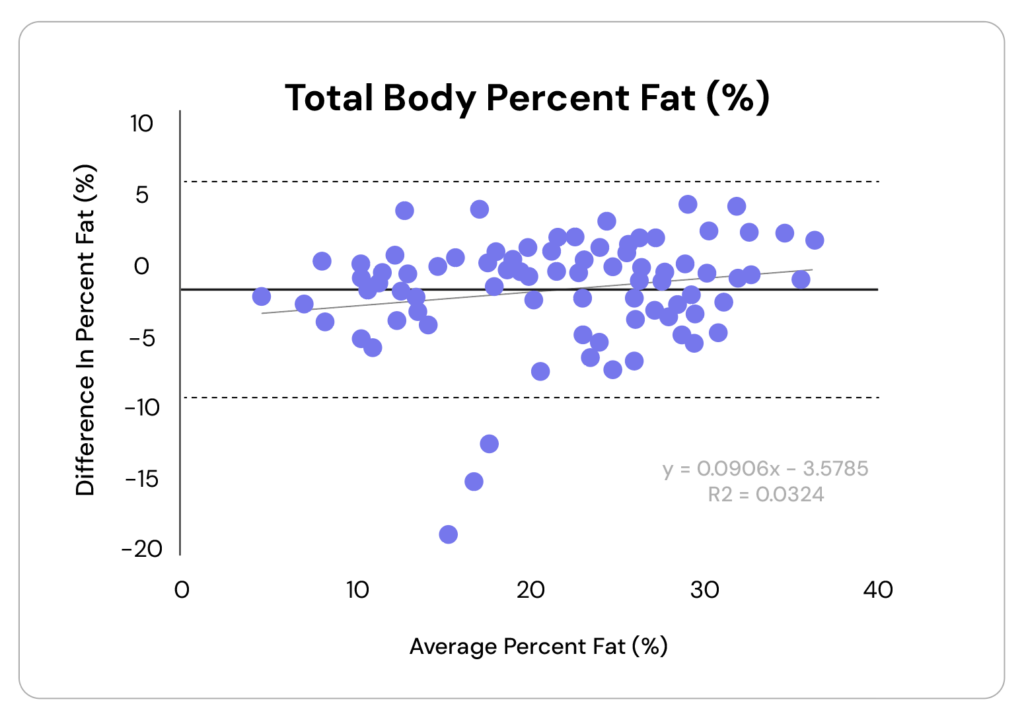
If you’ve never seen a Bland-Altman plot before, here’s what you’re looking at:
- Each dot represents one participant in the study.
- The horizontal axis shows each person’s average body fat estimate across the two methods. So if InBody estimated someone at 22% body fat and the 4C model estimated them at 26%, their dot would sit at 24% on the horizontal axis.
- The vertical axis shows the difference between those two estimates. Using the example above, the dot would sit at −4 percentage points because InBody underestimated body fat relative to the 4C model.
- A dot sitting on the zero line means perfect agreement. A dot sitting below zero means InBody underestimated.
- The further from zero, the worse the agreement.
- The dotted lines are the limits of agreement—the range within which 95% of differences fall.
So, looking at the dotted lines in the image, we can see the range spans from roughly +6% to -10%. Put differently, the InBody could overestimate body fat percentage by about 6 percentage points or underestimate it by about 10 percentage points. However, in some individuals, the error was even larger, approaching -20%.
To put that into context: If your InBody scan says you’re 20% body fat, your actual body fat percentage could plausibly be closer to 14% or 30%, based on the range of individual errors seen in this study.
But wait! There’s more.
Graybeal and colleagues tested multiple impedance devices against the 4C model in 27 competitive bodybuilders. The men averaged about 12% body fat, and the women averaged 20%.
The multi-frequency BIA device (a Seca mBCA, same octapolar category as InBody) overestimated body fat in male bodybuilders by an average of 4.5 percentage points.
But, as we’ve seen, that average hides how off it can be for individuals. Based on the 95% limits of agreement, the individual error ranged from roughly −1 to +10 percentage points. That means a male bodybuilder whose scan reads 15% body fat could realistically have a true value anywhere from 5% to 16%.
For women, the average overestimation was only about 1%. But the individual variation was substantially worse, spanning roughly −8 to +10 percentage points. Practically, a woman whose scan reads 25% body fat could have a true value anywhere from 15% to 33%.
It was so bad that the authors concluded the errors were large enough to “make the utility of these body composition estimates questionable at the individual level.”
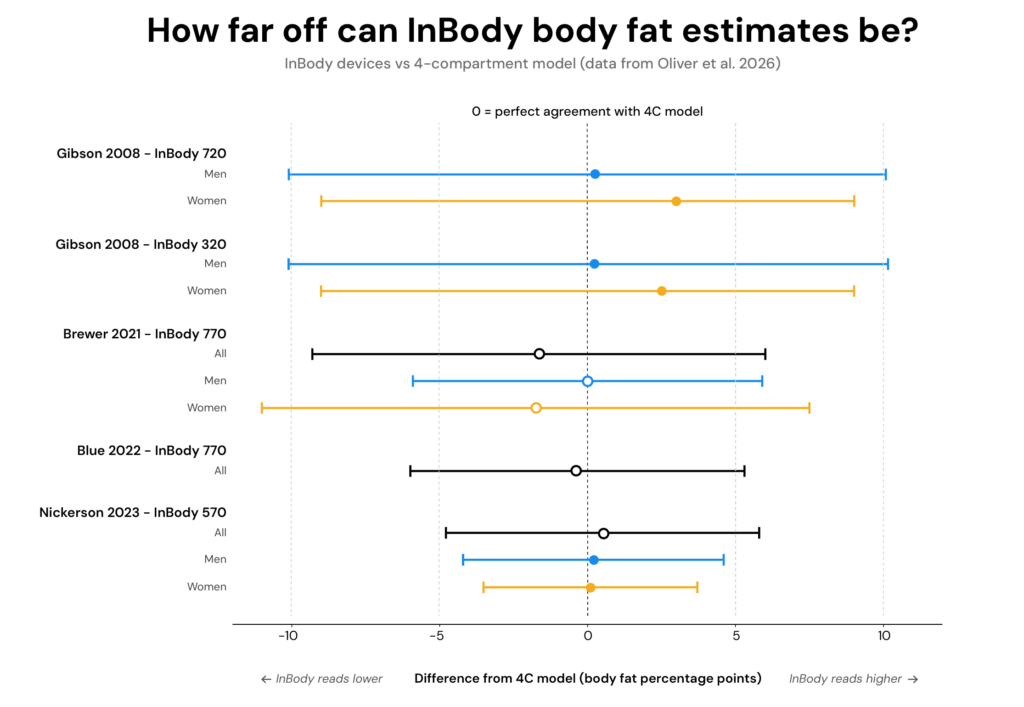
Finally, Oliver and colleagues recently published a systematic review comparing BIA devices to the 4-compartment model across 12 studies and three decades of research. The devices tested spanned the full spectrum of BIA technology–from basic single-frequency hand-to-foot devices and simple foot-to-foot scales to the sophisticated multi-frequency octopolar systems, including multiple InBody models, the Seca mBCA, and the Tanita MC-780U.
The story was the same across all of them. Average body fat estimates ranged from 3.5 percentage points lower to 4.4 percentage points higher than the 4C model. But individual errors spanned 15 to 20 percentage points.
Since this article is about InBody, the graph below pulls out the InBody-specific comparisons from the review. Depending on the model and study, the limits of agreement for body fat percentage spanned roughly 7 to 20 percentage points. That means an InBody reading of 20% body fat could, in some cases, reflect a true value closer to 14% or 30%.
This is an important concept to understand because I often see people claim the InBody is “only off by 3–4%.” But they’re confusing group averages with individual error. The average error tells you how the device performed across a group, where overestimates and underestimates can partially cancel each other out. But at the individual level, the errors can be large enough that the result has limited real-world utility. If you’re getting a body fat test, I’m assuming you want to know your actual body fat percentage — not an estimate that could span multiple body fat categories.
What about tracking trends?
At this point, I’m sure some of you are thinking, “Sure, maybe body fat testing isn’t perfectly accurate, but at least it gives me a decent idea of the trend over time.”
I wouldn’t be so sure.
When we talk about trend tracking, we’re tacitly assuming there’s enough signal amid the noise for the data to be useful for decision making. For example, your weight might fluctuate day to day, but over a few weeks, you can get a pretty good idea of whether you’re losing, gaining, or maintaining weight.
Body composition testing doesn’t work that way–especially if you’re using a method that relies on inferences from your total body water, like InBody (or any BIA device, really).
When researchers assess the reliability of InBody, they report something called an intraclass correlation coefficient (ICC). We don’t need to get too deep into what it is. All you need to know is that it’s a number between 0 and 1, with higher values usually interpreted as indicating better reliability.
InBody tends to score pretty high in this metric. For example, a 2024 study tested InBody under tightly controlled conditions, with participants tested 10 times across 5 separate lab visits. The ICCs for body fat percentage and whole-body fat mass were 0.998 and 0.999, respectively.
But here’s the thing: ICC isn’t measuring how reliable InBody is for tracking change within an individual; it’s measuring how well the machine can differentiate between individuals. In the same study, the participants’ fat mass varied by 7.3 kg (~16 lbs). However, when researchers scanned the same participant twice, the reading only differed by 0.2kg. In other words, the difference between individuals was so much higher than the machine’s measurement noise that getting a high ICC isn’t that impressive.
The actual figure we need to look at is how much an individual participant’s fat mass varied across those ten scans. The answer was 1.5 ± 0.6 kg (~3 ± 1.3 lbs) on average — meaning for some participants, fat mass fluctuated by over 2 kg between scans without any real change in their body composition.
Just to make sure I’m being clear: Even under tightly controlled lab conditions, where researchers were standardising hydration, food intake, and exercise before every visit, the same person’s fat mass reading could vary by up to 2 kg (~4.4 lbs) between scans, without any real change in their body composition because of normal day-to-day biological fluctuation and the device’s own measurement noise.
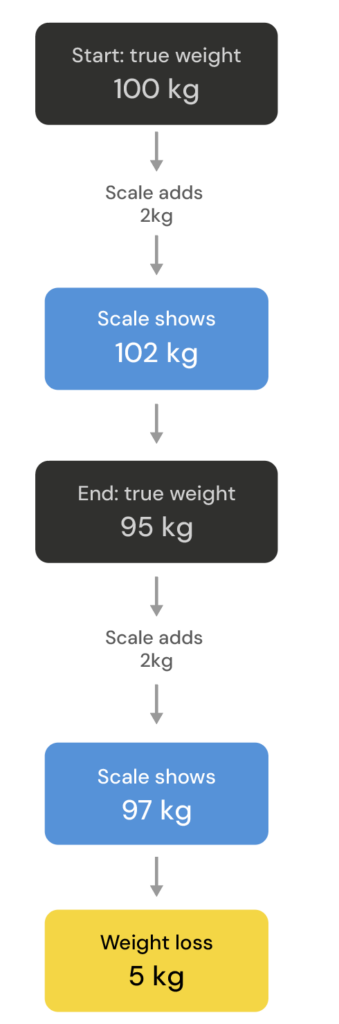
For trend tracking to work, the error has to be consistent. For example, imagine your bathroom scale is miscalibrated and always adds 2kg to your ‘true’ weight. That’s a consistent error. If you lose 5 kg, it doesn’t matter if every reading you got was ‘wrong’. The actual number was consistently wrong, so it was still useful.
BIA devices, like InBody, have inconsistent error. Because the machine infers fat- and fat-free mass from total body water, factors like hydration can introduce error from scan to scan.
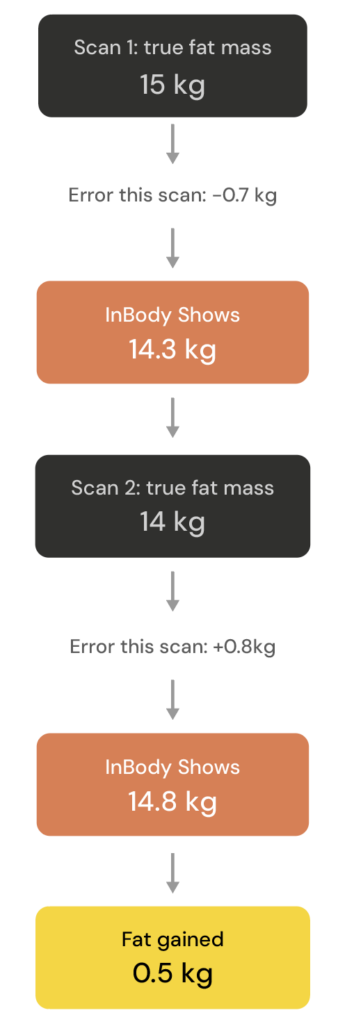
In practice, this means your true fat mass might be 15kg at the start of a diet. But maybe you had a few drinks the night before, so you’re slightly dehydrated on scan day. InBody doesn’t know that, it just ‘sees’ less water, so it reports your fat mass a bit lower at 14.3kg. A few weeks later, you’ve lost 1 kg of real fat, bringing your true fat mass to 14 kg. But this time, you scanned after a rest day, and you’re well hydrated. InBody now reports your fat mass as 14.8 kg. You actually lost 1kg of fat, but InBody reports your fat mass increased by half a kilogram.
Some of this is due to the different pre-testing conditions, but there’s another factor at play, which we’ll get to in a moment.
There’s also a practical problem with tracking a body composition trend. Most people track things like their nutrition and weight to make timely decisions. If your weight loss is too slow or too fast, you could identify that within two weeks and make the necessary adjustments.
Most people aren’t getting a body composition test every week, since you need to allow enough time for changes to actually happen. If you plan to diet for 6 months and get an InBody scan every 2 months, you’ll have only 3 data points by the end of your diet. Is that actually a trend? Moreover, your diet’s ended, so any information you do glean from these scans isn’t providing you with any information that you don’t already know. Do you look leaner in the mirror? Are your clothes fitting better? Do you have more energy? Have your lifts improved? You don’t need a printout from a machine to answer all those questions.
In short, InBody’s error isn’t consistent enough for it to be useful as a trend-tracking tool. Furthermore, you would need to wait months to have enough information to act on, by which point you would already know whether the diet was a success.
Standardisation and the minimum detectable change
For InBody readings to be useful in some capacity over time, you’d need to replicate the exact same conditions at every scan. That means noting down every variable at your first scan and matching them precisely each time after: the same time of day, whether you trained the day before, how much water you’d drunk, and whether you’d consumed alcohol in the past 48 hours (since alcohol can cause dehydration). For women, it also means scanning at the same point in your menstrual cycle to account for hormonal water retention.
But, as I’m sure you can imagine, replicating exact conditions between scans is very hard. Unfortunately, if you’re not standardising the testing conditions, you’re introducing a lot of noise that’ll throw the machine for a loop.
Here’s an example: Tinsley and colleagues assessed different methods for tracking body composition over time, and how standardising testing influenced the results.
Nineteen resistance-trained men followed a 6-week supervised training programme while eating in a caloric surplus, intentionally designed to promote muscle gain. Before the study began, participants were scanned twice on the same day; once in the morning under standardised conditions (fasted, rested, no food, drink, caffeine, or exercise for at least 8 hours), and once in the afternoon with no restrictions. The same two scans were repeated at the end of the 6 weeks.
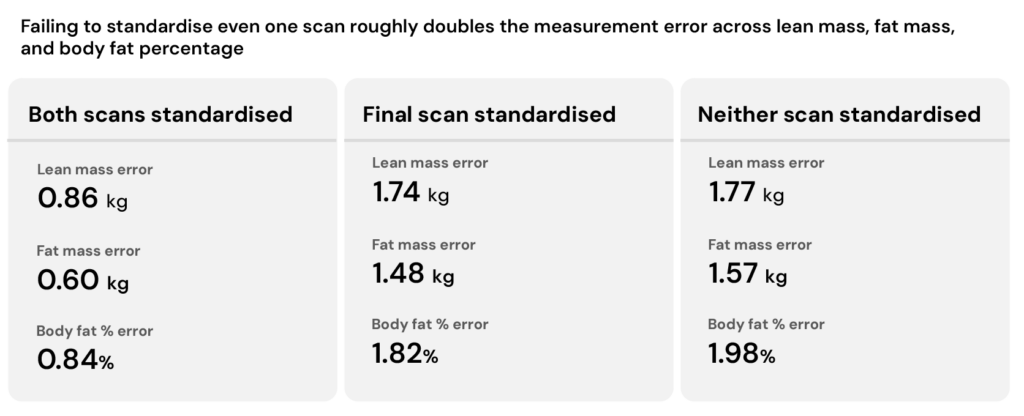
The researchers found that changes in lean mass were “often artificially inflated” when baseline testing was standardised but final testing wasn’t, and “artificially diminished” in the reverse scenario. And for smaller changes in fat mass and body fat percentage, the direction of change actually reversed for some methods, and InBody was among those significantly affected by whether or not conditions were standardised.
But let’s say you can perfectly match conditions between tests. You still have to contend with another issue. Every measuring device has a degree of inherent noise in its readings, and InBody is no different. In research settings, this is often referred to as the minimum detectable change (or the least significant change). And as the name suggests, it’s the smallest change that needs to occur before you can be confident it’s a real change and not just random noise in the device.
A 2020 study tested three different InBody models (230, 720, and 770) under controlled conditions, but not dissimilar to how most people might go in for an InBody scan: no food or drink for 4 hours before testing, no exercise or alcohol for 24 hours before testing, and at the same time of day for each visit.
Across all three InBody models, the minimum detectable changes were:
- Body fat: 2.1-2.7%
- Fat mass: 1.5-2.4 kg (3.3-5.3 lbs)
- Fat-free mass: 1.6-2.3 kg (3.5-5.1 lbs)
In other words, you would need to see a decrease in body fat percentage of more than 2.7% or 2.4kg of fat mass to be confident you actually lost body fat. Likewise, you would need to see fat-free mass increase by more than 2.3 kg before you could be fairly confident the change was real (and even then, fat-free mass isn’t just muscle–It includes water, glycogen, organs, and connective tissue, so a 2.3 kg increase in fat-free mass doesn’t mean you gained 2.3 kg of muscle tissue).
And remember, this is still under fairly controlled conditions. If you’re not applying the same level of control, the minimum detectable change could easily be double the numbers above.
Now, picture a pretty typical diet. Someone eats 500 calories below their maintenance every day and is losing a pound per week. After 5 weeks of dieting, they’ve only just reached the point where InBody might be able to detect a true change. To be safe, they might push this to 6 weeks. But if someone is almost two months into a diet and we assume they’ve been consistent, they can already see visual changes in the mirror, notice their body measurements are decreasing, and clothes are fitting better, which would render an InBody scan moot anyway.
But, you might say, it would be nice to know how well the diet is going–am I maintaining muscle while losing fat? It might be nice, but you run into the same standardisation problem.
At the start of a diet, your muscles are stocked with glycogen, and every gram of glycogen holds roughly 3g of water. A few weeks into a deficit, muscle glycogen drops, and so does the water it’s bound with. Recall from earlier that BIA devices aren’t directly measuring fat and muscle; they’re measuring water and inferring tissue composition from it. So any shift in body water can skew the device’s readings.
Just to illustrate the point: A 2022 study had 20 healthy adults drink about 800 ml of water and then take repeated InBody scans over the following hour. The increase in body mass from the fluid intake was interpreted entirely as fat. By the final scan, fat mass was 1.3 kg higher than at baseline, despite no actual change in tissue.
For a true comparison, you would need to scan at the start of your diet and then at the end of the diet, once you’re back to maintenance, while also keeping the testing conditions as standardised as possible.
Even then, you’re leaning on the assumption that InBody can give you a decent idea of how much your body composition has changed, if it can even detect that change in the first place. But as we’ve established, InBody gives you a number. How accurately that printout reflects your actual body composition is anybody’s guess.
So InBody can’t accurately tell you your body fat percentage, can’t track it reliably over time, and requires testing conditions you’ll probably never replicate. But there’s a more fundamental question worth asking: even if it could do all of those things perfectly, would the number actually matter?
You don’t actually care about your body fat percentage
Here’s a question: If I snapped my fingers and you suddenly had your ideal body composition, but your body fat percentage was higher than you wanted, would you care? Probably not.
The reason you care about your body fat percentage is because you think if you hit that number, you’ll have the body composition associated with it. But that isn’t necessarily true. Maybe you hit your target body fat percentage and realise you’re lacking enough muscle mass. The opposite can also be true. You could increase your body fat percentage and look closer to whatever body composition you envisioned (since muscle mass will help you look leaner even at a slightly higher body fat percentage).
The problem with this body fat percentage obsession is forgetting that there are so many other things that contribute to your aesthetic appearance and your overall health and fitness. Your body fat percentage is a single number. Your body composition is the result of muscle, body fat, bone structure, how you eat, how you train, recovery, and so on.
If we agree that body composition is really the thing you care about, then you don’t need a scan to confirm what you already know. For example, maybe your clothes fit tighter than they used to, or you don’t like how you look in the mirror–you don’t need to know your exact fat mass down to the gram to know you should find a sensible way to lose fat. Or, maybe you want to be bigger and stronger; you don’t need to know your lean mass to know you should start lifting weights and eat more food.
And a lot of the time, you aren’t getting a body composition test for information; you’re looking for confirmation of your efforts. You just want some numbers to validate what you’re already seeing. And maybe it does. Maybe the scan tells you that you lost fat and maintained all of your muscle mass, fantastic. But what if the opposite happens? What if the scan diverges from your expectations and reports you lost less fat and more muscle than you anticipated? Do those results–which I’ve spent the last several thousand words showing are very likely wrong–take away from how you look and feel? I suspect not. So, then a scan isn’t adding any value.
In other words, you don’t need to measure your body composition to know your body composition is changing, and ‘low-tech’ methods of tracking progress, like the scale, body measurements, progress photos, and training performance, are more reliable, informative, and actionable than whatever fancy body composition testing gadget you’re being marketed.
TL;DR
- InBody doesn’t directly measure body fat or muscle. It measures electrical resistance, estimates total body water, and then works backwards to estimate fat-free mass, fat mass, and body fat percentage.
- The group averages can look decent, but individual results can be wildly off. Research comparing BIA/InBody-style devices with the 4-compartment model shows that individual body fat estimates can be off by 10–20 percentage points.
- It’s not reliable enough for tracking small changes over time. Hydration, glycogen, food intake, alcohol, training, and menstrual cycle changes can all shift the results without any real change in body composition.
- Even under controlled conditions, changes need to be fairly large before you can trust them. You may need to see a change of around 2–3% body fat or 1.5–2.5 kg of fat/lean mass before it’s likely to be real rather than noise.
- You don’t need to measure your body composition to know your body composition is changing. ‘Low-tech’ methods of tracking progress, like the scale, body measurements, progress photos, and training performance, are more reliable, informative, and actionable than whatever fancy body composition testing gadget you’re being marketed.
Thanks for reading. If you enjoyed this, you’d love the Vitamin

95% of my new content is only sent to my email list. One email every Thursday, filled with actionable, evidence-based fitness advice to help you with your goals. If you enjoyed this, you’ll love my emails. You can learn more and subscribe for free here.